China Export Growth Slowed to 24% in July While Trans-Pacific Rates Climbed
The number that produced the slowdown headlines was an export gain of roughly 24% year on year in July, down from about 27% in June. Customs also reported the trade surplus narrowing to $112.5 billion from $125.6 billion, with imports up 27.5% against a 36% jump the month before. Both prints came in ahead of what analysts expected. In almost any other year, a 24% export print would have been the story by itself rather than the evidence of decline.
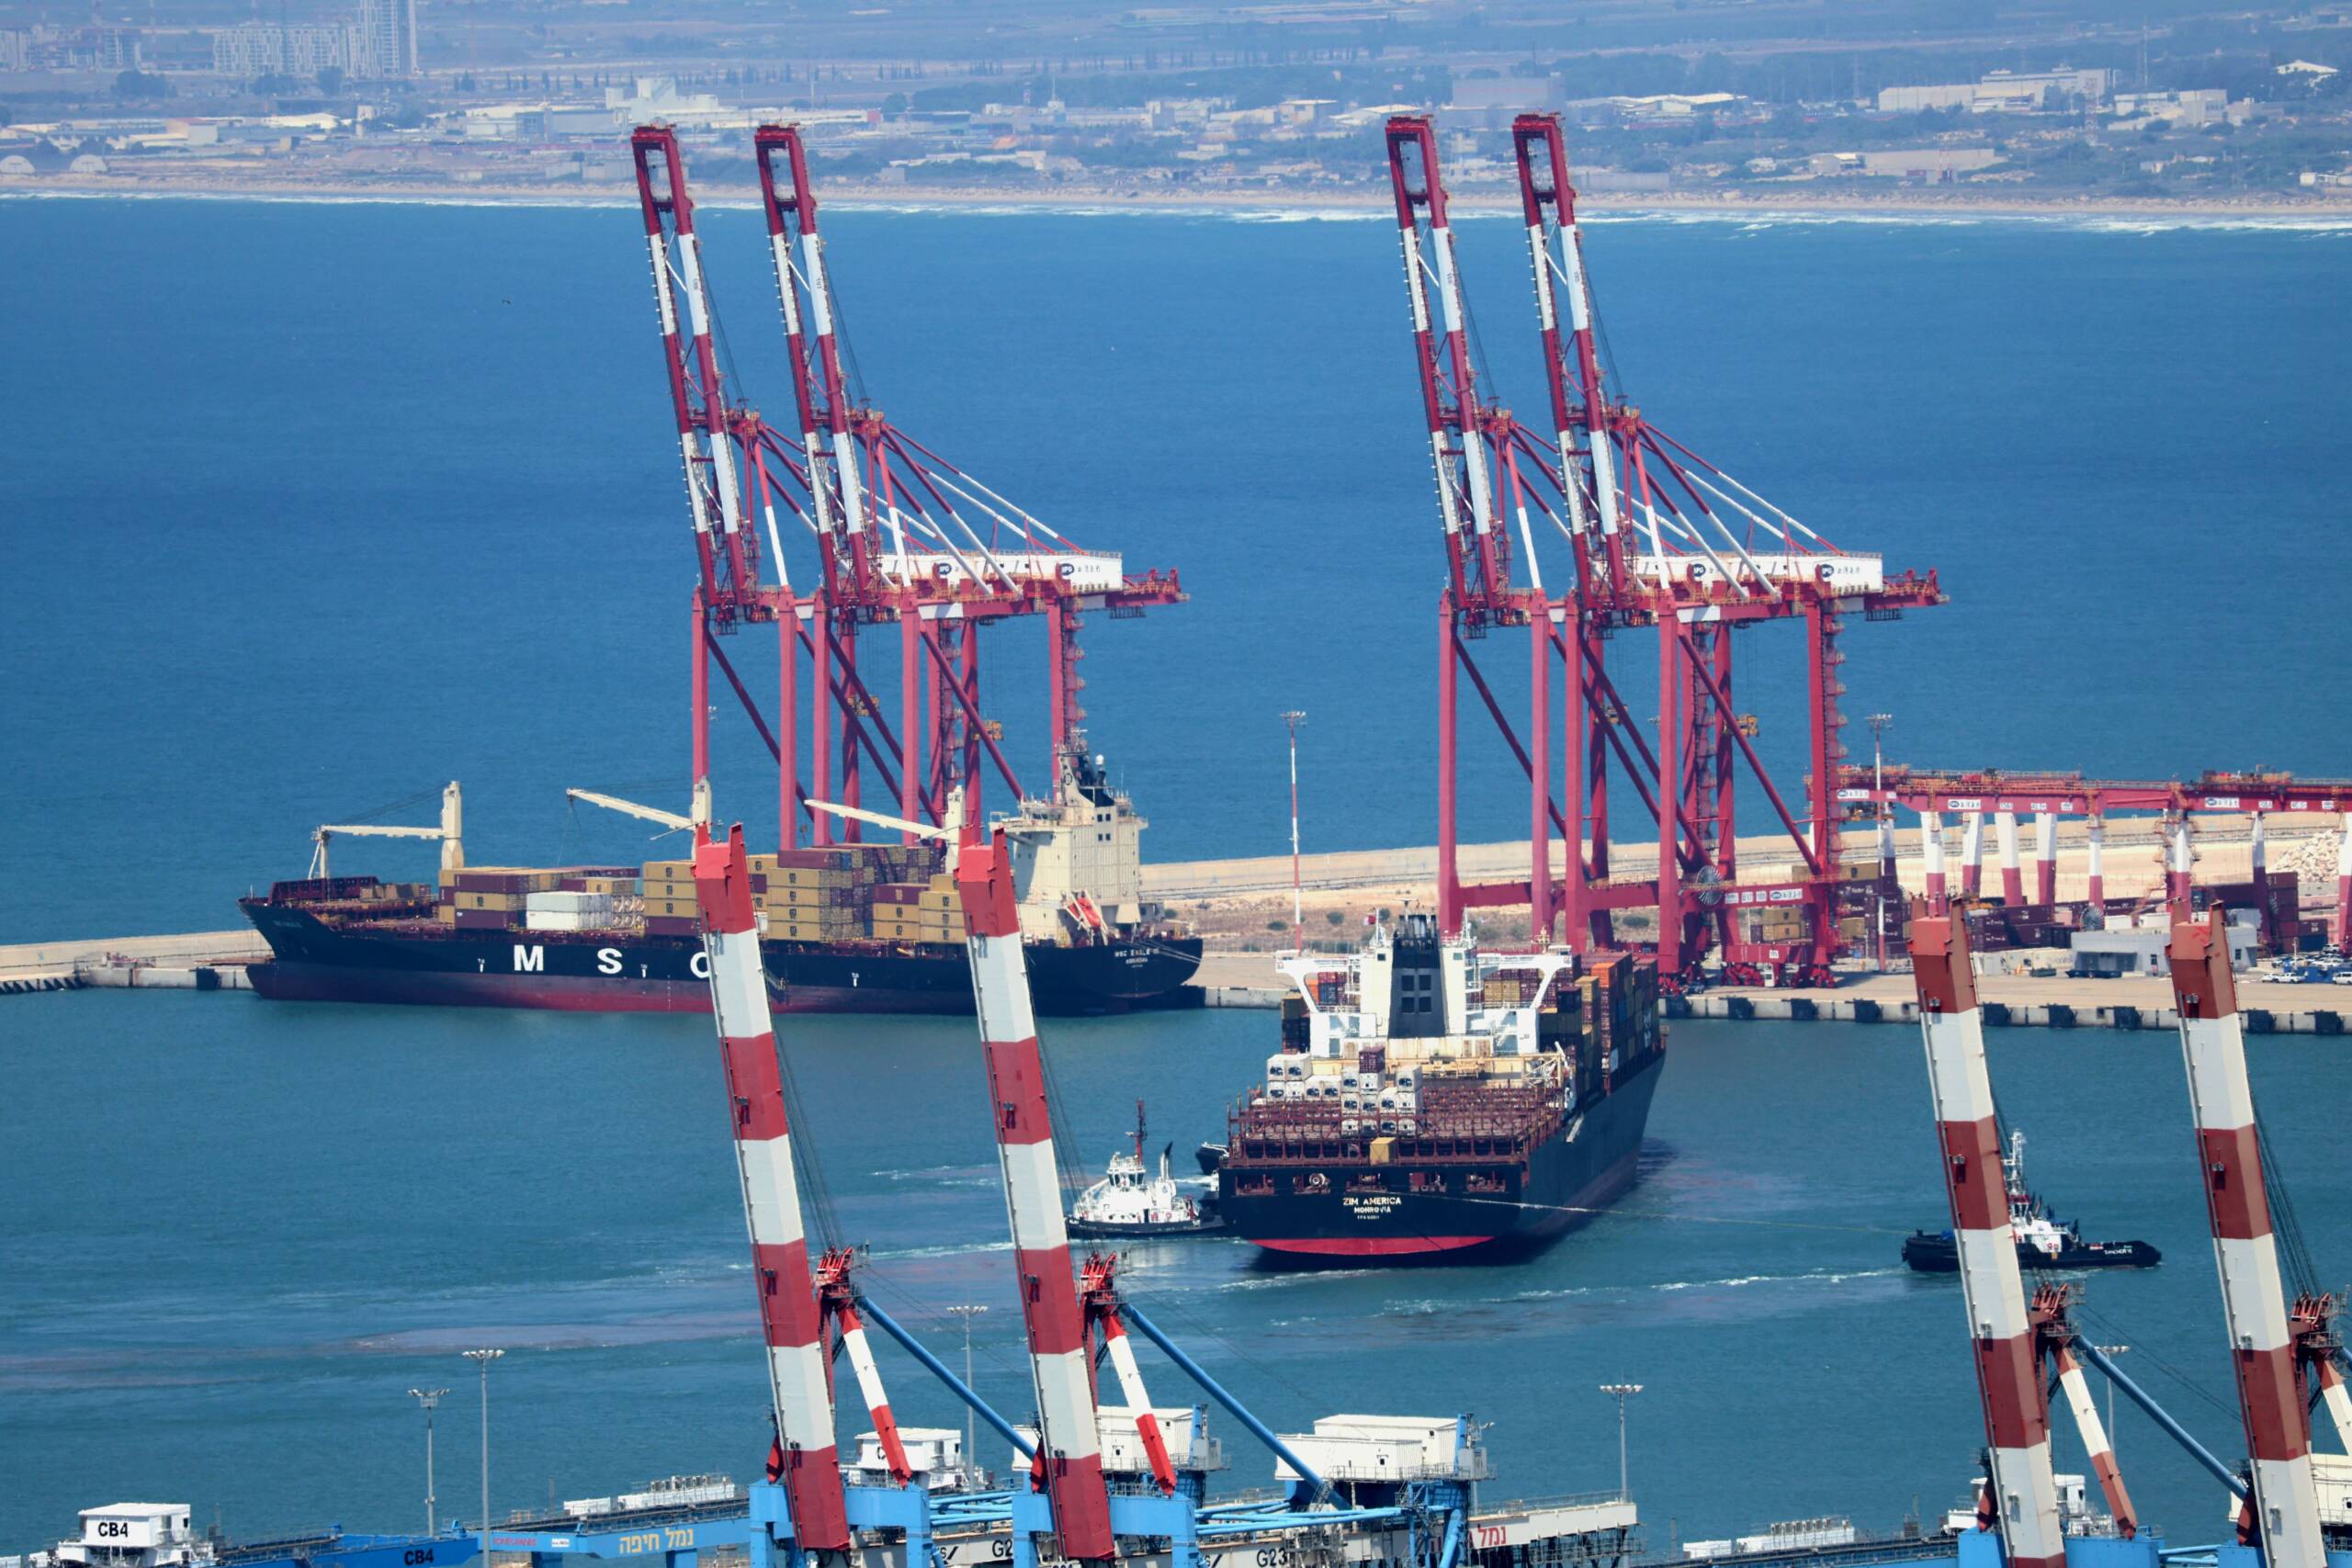
Part of the July gap is weather. Typhoon disruption to port operations in East and South China pulled loadings out of the month and pushed them into August, which is also why some of the schedule reliability problems showed up later in the transpacific booking window. That is a timing effect, not a demand signal, and it will reverse.
The mix changed more than the volume did
The more useful figures are cumulative. Over January to July, high-tech exports rose close to 41%, vehicle shipments jumped about 55%, and the broad electronics and machinery category grew roughly 26%. What China is loading has shifted decisively toward capital goods, components and finished vehicles, and away from the low-cost consumer categories that used to define the export book.
That matters for anyone forecasting volumes. Machinery and components sold into other countries’ factories respond to industrial investment cycles, not to retail sentiment in a single destination market. They are also harder to source elsewhere on short notice, which is why several years of tariff pressure have redirected where Chinese goods go without doing much to how many leave.
Destination moved first
US-bound container bookings out of China remain far below their 2024 peak, and have done for most of this year. Total exports still grew at more than 20%. Those two facts only fit together if the growth is coming from somewhere other than the United States, and it is: Europe, Southeast Asia, the Gulf, Latin America and Africa have all absorbed more.
The Southeast Asian transpacific share that keeps expanding is a related story rather than a competing one. Vietnamese, Thai and Indonesian origins are taking US-bound volume, and a significant portion of what they ship contains Chinese components that already crossed a border once. Reading a decline in direct China-to-US container counts as a decline in Chinese export activity misses the intermediate leg.
The tariff calendar makes July almost unreadable
The temporary 10% Section 122 import surcharge in the United States expired on 24 July after hitting its 150-day statutory limit. On the same day a new forced-labor Section 301 action took effect covering products from 60 economies, adding 12.5% on covered China-origin goods. The in-transit grace period then ran out at the start of August, moving compliance to an entry-by-entry basis.
Any month containing a tariff expiry and a tariff imposition on the same date will show front-loading before it and digestion after it. Month-on-month comparisons across that boundary are close to meaningless. The cleaner read comes in the September and October data, once the new duty structure has been in force for a full cycle.
Freight rates are pointing the other way
If July marked the start of a genuine export contraction, spot rates should be falling. They are not. The Shanghai Containerized Freight Index kept rising through the first half of August. Drewry’s World Container Index gained about 1% to roughly $4,297 per FEU on 6 August, ending three consecutive weekly declines, with Shanghai to New York near $7,893 and Shanghai to Los Angeles near $5,894. Freightos assessments put Asia to US East Coast spot rates at their highest level of 2026.
The caveat is real. Carriers have been managing capacity aggressively, with a heavy cluster of blank sailings scheduled between 31 August and 6 September, and withdrawn capacity can lift rates on flat volume. Rates are a weak proxy for demand in a market this actively rationed. Still, a rate curve turning upward through a supposed export slowdown is worth more attention than a three-point deceleration in a year-on-year growth rate.
Three things decide whether the slowdown framing survives the next two data releases. Whether import growth keeps decelerating faster than exports, which would say more about domestic demand than about foreign orders. Whether the surplus continues to narrow. And whether the fourth-quarter base effects, which get much harder from here, turn positive volume growth into negative-looking headlines.
The slowdown so far is arithmetic. The composition shift is not.